

Visualization is not just pretty to look at: In B2B, it can transform the engagement with complex products and services into a positive customer experience.
The art lies in abstracting information and presenting it in a customer-centric way without reducing its depth of information and thus its value. On the way there, three central questions must be answered:
- What information do my customers need?
- How far can it be simplified without losing or distorting important connections?
- How can they be linked to emotions in order to create quick and sustainable access to the factual level?
It sounds easier than it is. We are often so convinced of the fantastic features of our own products and services that we would prefer to present our potential customers with our entire belly-load of facts and arguments at once. But it's all about striking the right balance between information content and simplicity.
Our tip
The more precisely you anticipate the customer's questions, the better you can focus on what is really important and leave out superfluous details.
The bottom line is communication. The other person thinks and interprets differently than you do. Deal with it.
Why we sometimes just don't understand each other
There are many models of communication that, in summary, are primarily about how messages or news are conveyed and received. The Shannon-Weaver model is one of them (cf. source 1). Also known as the sender-receiver model, it deals with the classic of every conversation: one person speaks, the other listens. The exciting question here is: What happens between the speaker and the listener?
That's where the magic of digital B2B communication lies: We need to build a simple bridge between complex products or offers and the needs of a very diverse audience.
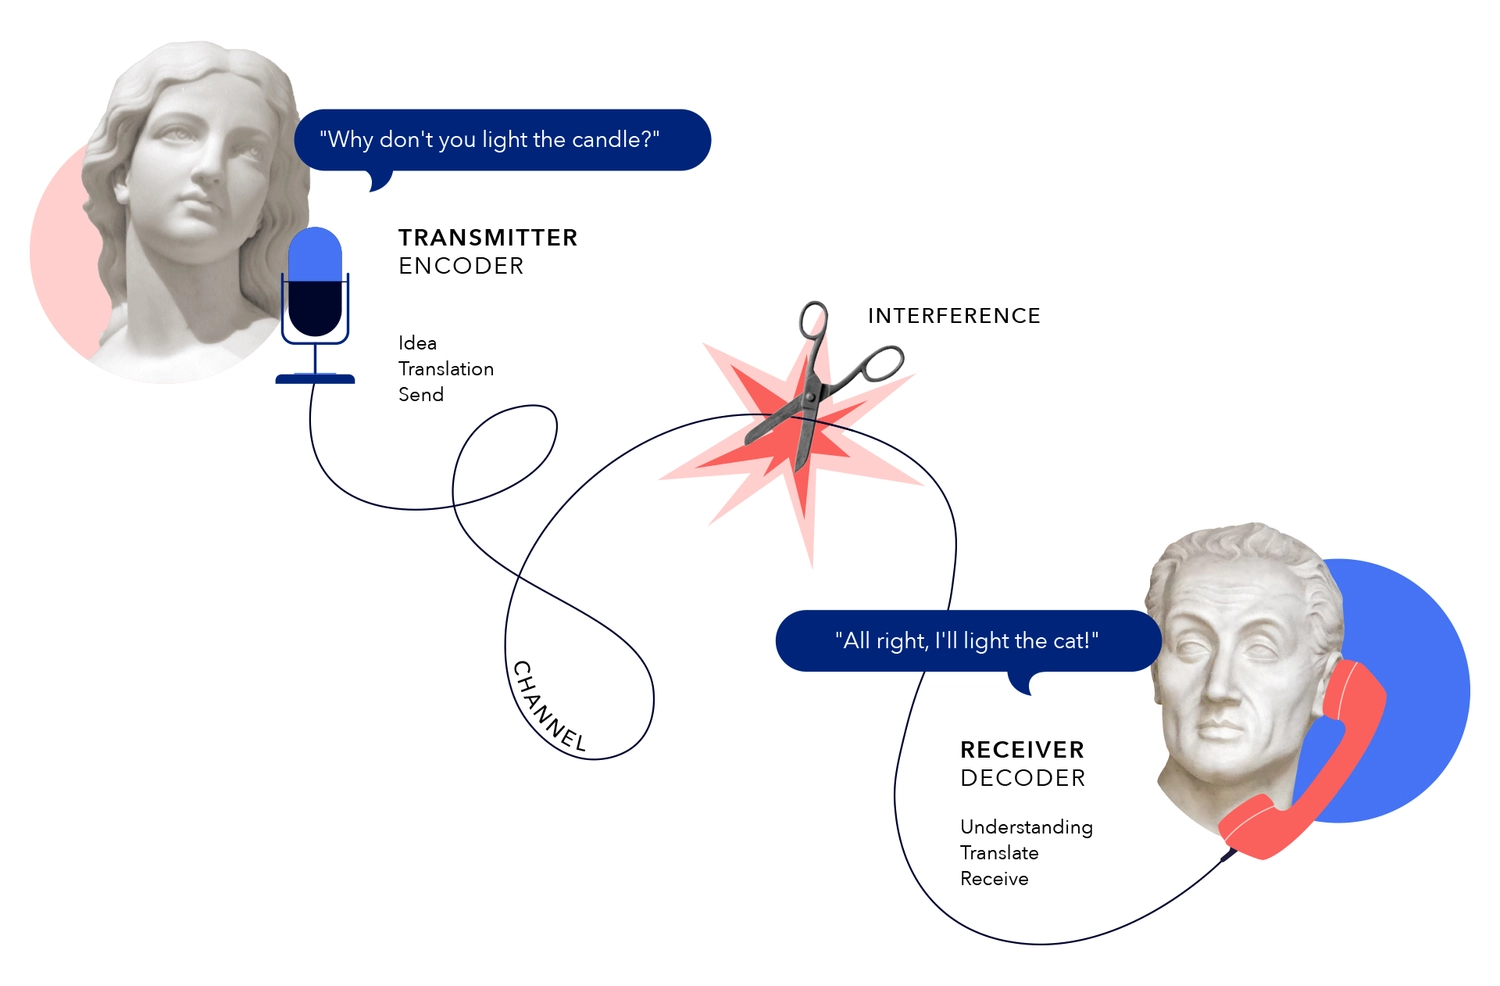
If you look closely, you can see: Two translations of one piece of information are necessary, once from the sender and the other time from the receiver. The interface: the channel.
What does this mean for B2B communication?
Digital communication in particular is not symmetrical - it takes place asymmetrically, i.e. with a time lag. Options to ask questions directly or to recognize understanding or confusion from gestures and facial expressions do not exist in the same way as in a classic conversation. What's more, the information offered online is often too much, too complicated, or simply not comprehensible: a hurdle for users, who feel lost under the volume and complexity of content. So new bridges are urgently needed.
With this in mind, when it comes to complex information, visualization is a very powerful tool to bring the sender's idea and the receiver's need as close together as possible: While we want to get our message across, it's also about what our counterpart needs to hear in order for it to really resonate. So we think about both translation steps in visualization and try to keep the discrepancy between intention and understanding of our message as small as possible.
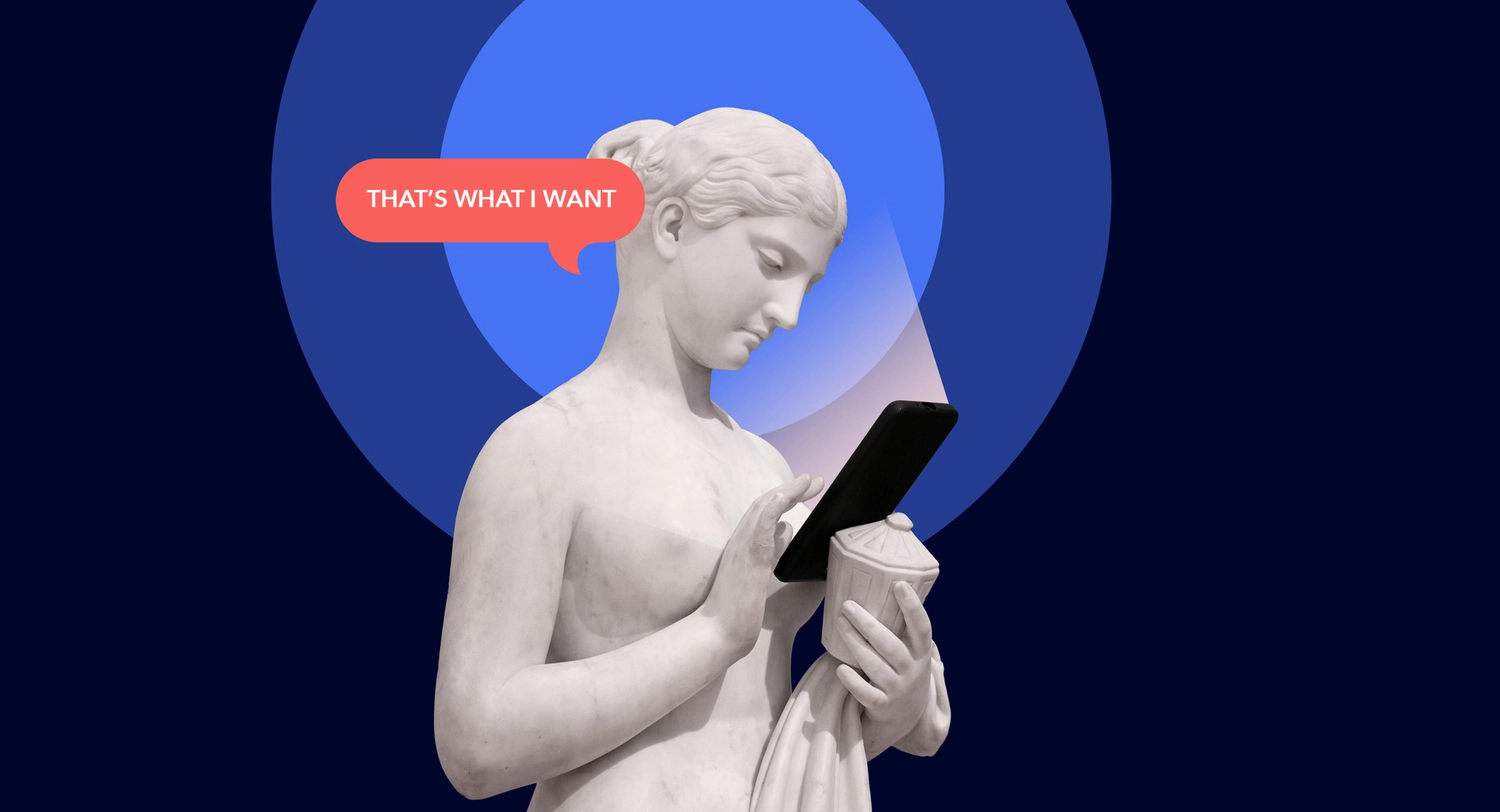
In addition, we also use visualization to find an emotional way into the memory of our customers. The field of neuromarketing counts precisely on this and uses findings from brain research and psychology to understand and influence purchasing decisions.
Everything that does not trigger emotions is worthless for our brain.Author of Think limbic! and Brain View
Because: Images quickly trigger strong emotions that relate to basic human emotions - and these help our memory. Much more so than purely rational arguments. This is ensured by the so-called limbic system: a part of our brain in which the unconscious and emotions have the say - and significantly influence our purchase decisions. (Cf. source 2)
If we understand how to use visualization to simplify complex issues and appeal to the right emotions in our target group, we will find the fastest way into our customers' brains. The following two cases show how it works.
Case 1
Best practice for a complex product: The Celonis key visual
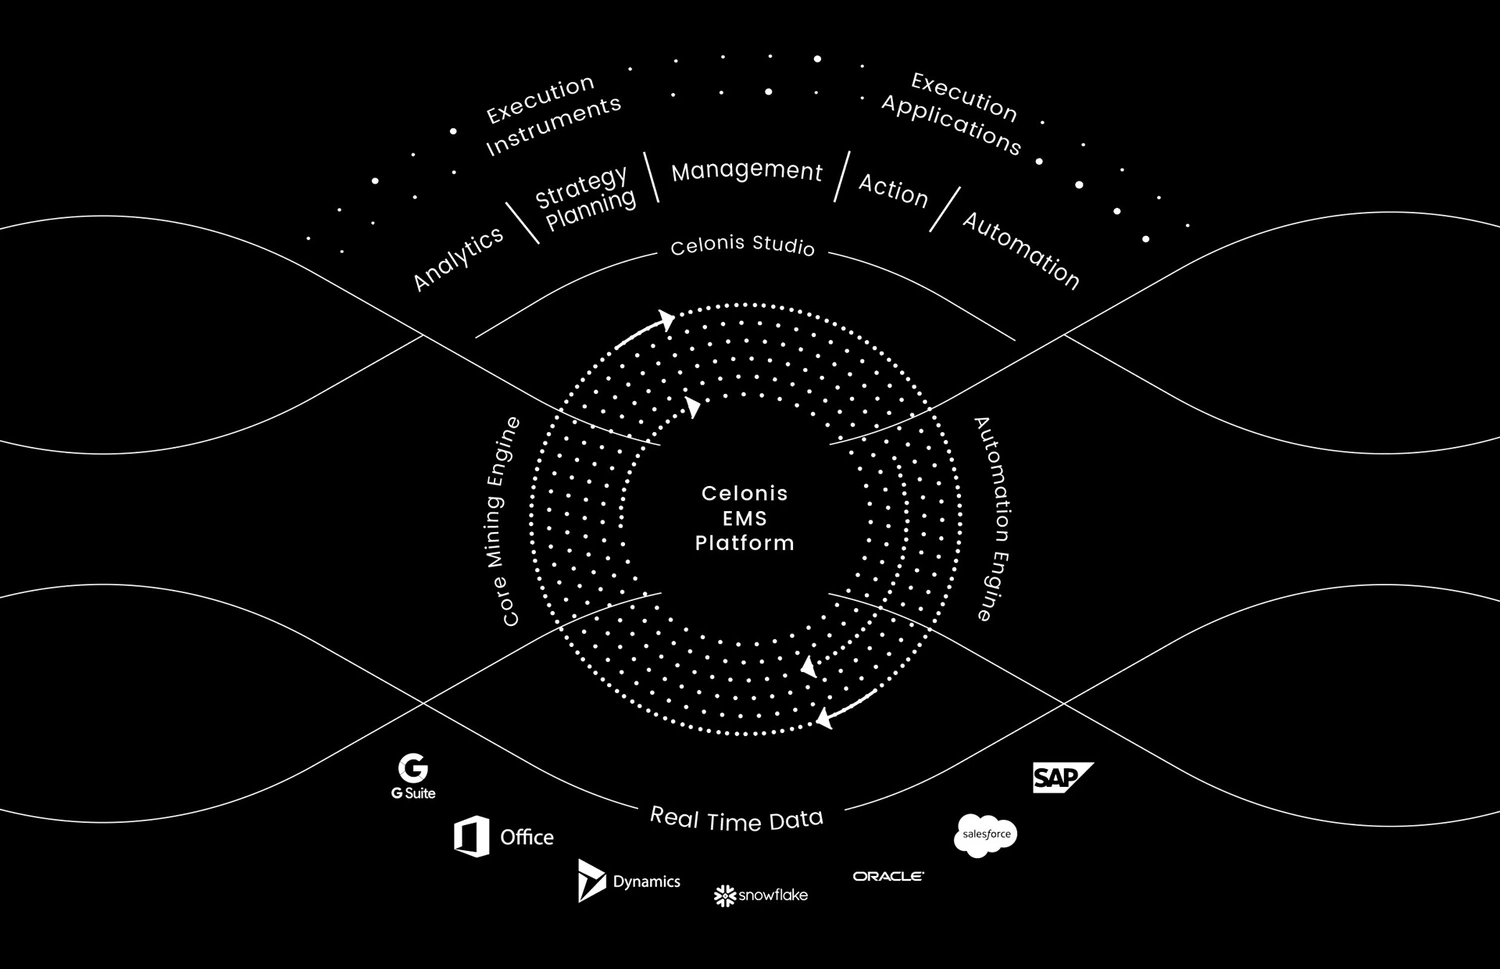
Celonis has created a new and technically complex product with the Execution Management System (EMS). Flanked by well-structured texts and supplementary images, a product that is difficult to grasp is nevertheless explained in a comprehensible way with the help of visualization: the interaction of design and content is a decisive factor here. (Cf. source 3)
Five things to look for:
- The shape of an eye creates a familiar frame and symbolizes the goal of the solution: Identify inefficiencies in processes.
- Less is more: The maximum reduction of content achieves clarity and directs the viewer to the central information.
- The focus is not on the company's own processes, but on those of the target group - and what the product achieves for companies.
- A look at various application examples shows: Visualization only comes into its own through context.
- In marketing communication, combinations of comparisons and appropriate images also provide easily grasped explanations: The recurring reference to socio-cultural or industrial breakthroughs quickly conveys the benefits that Celonis' offering brings to companies - and triggers positive emotions that are directly linked to the product.
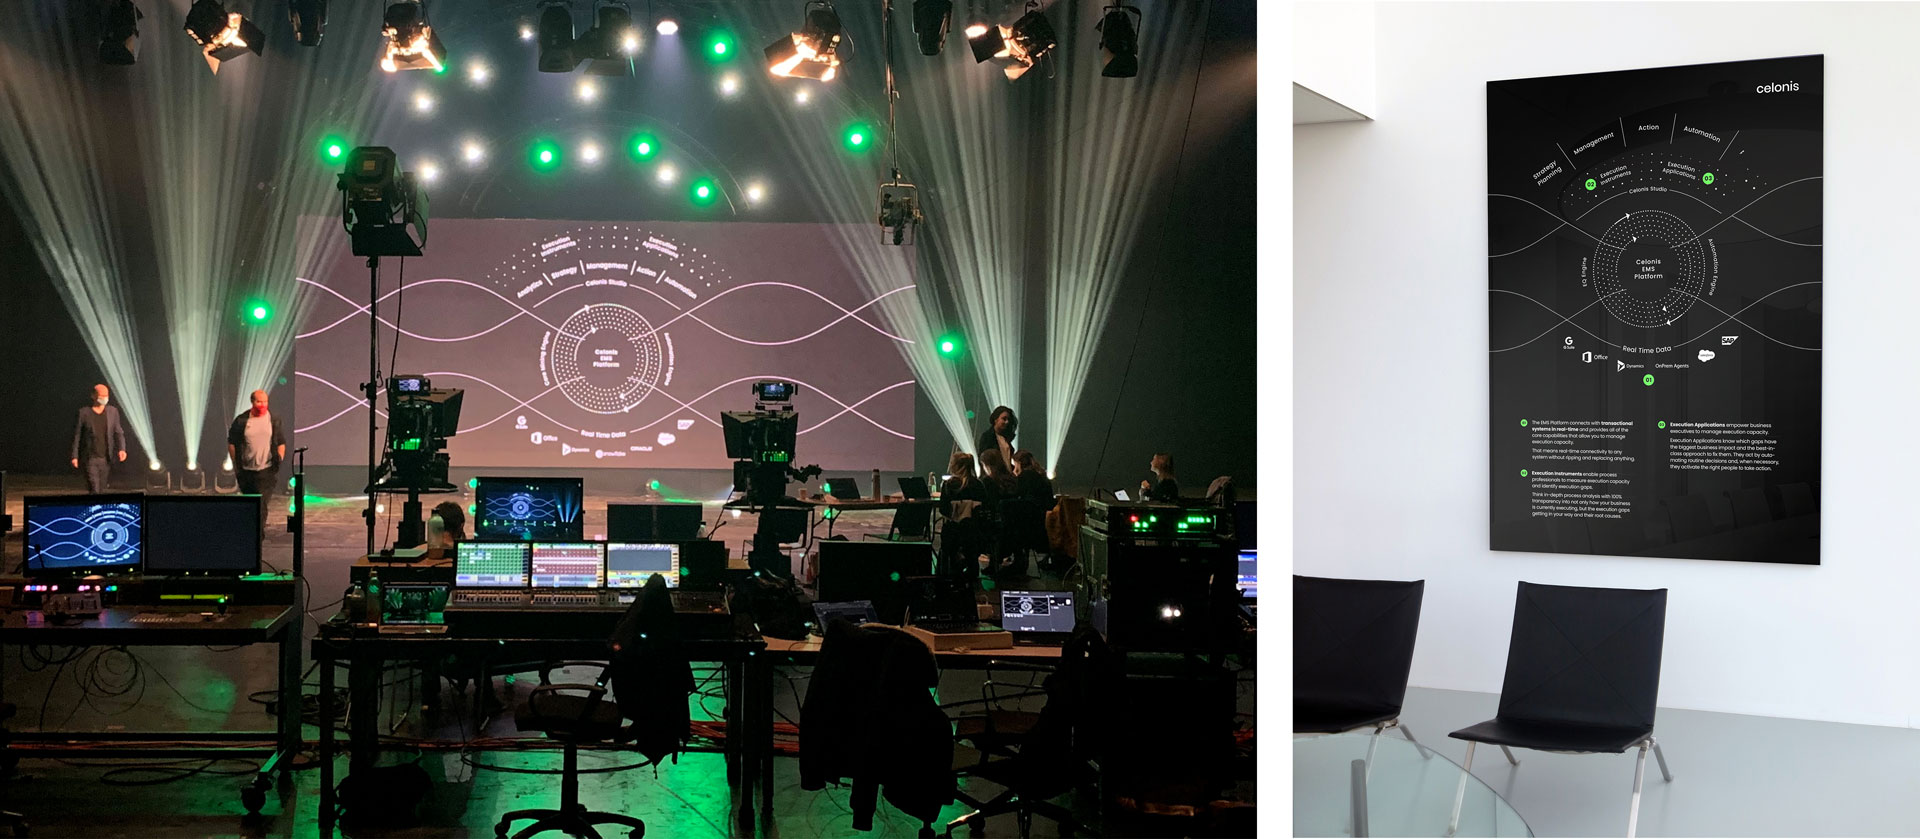
Application examples for 4.: Event and poster - the context is created by lectures and text with further information. We remember the visual, with the context together we understand the complex product.
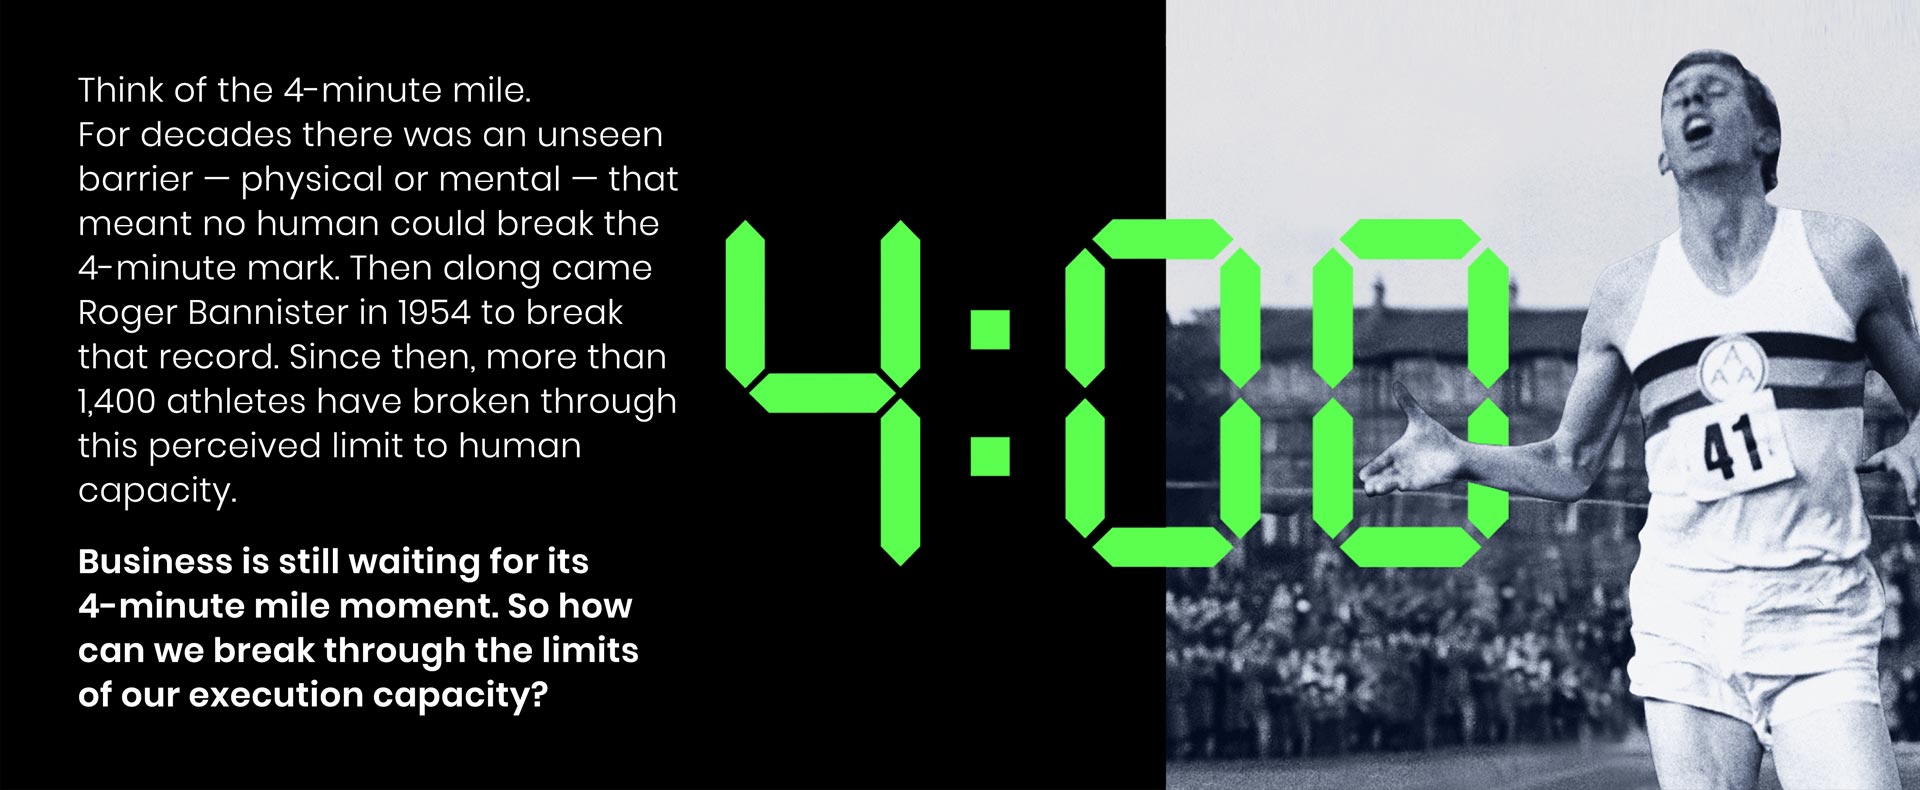
Example to 5. Comparisons with well-known breakthroughs provide positive emotional reinforcement of Celonis' brand promise.
Case 2
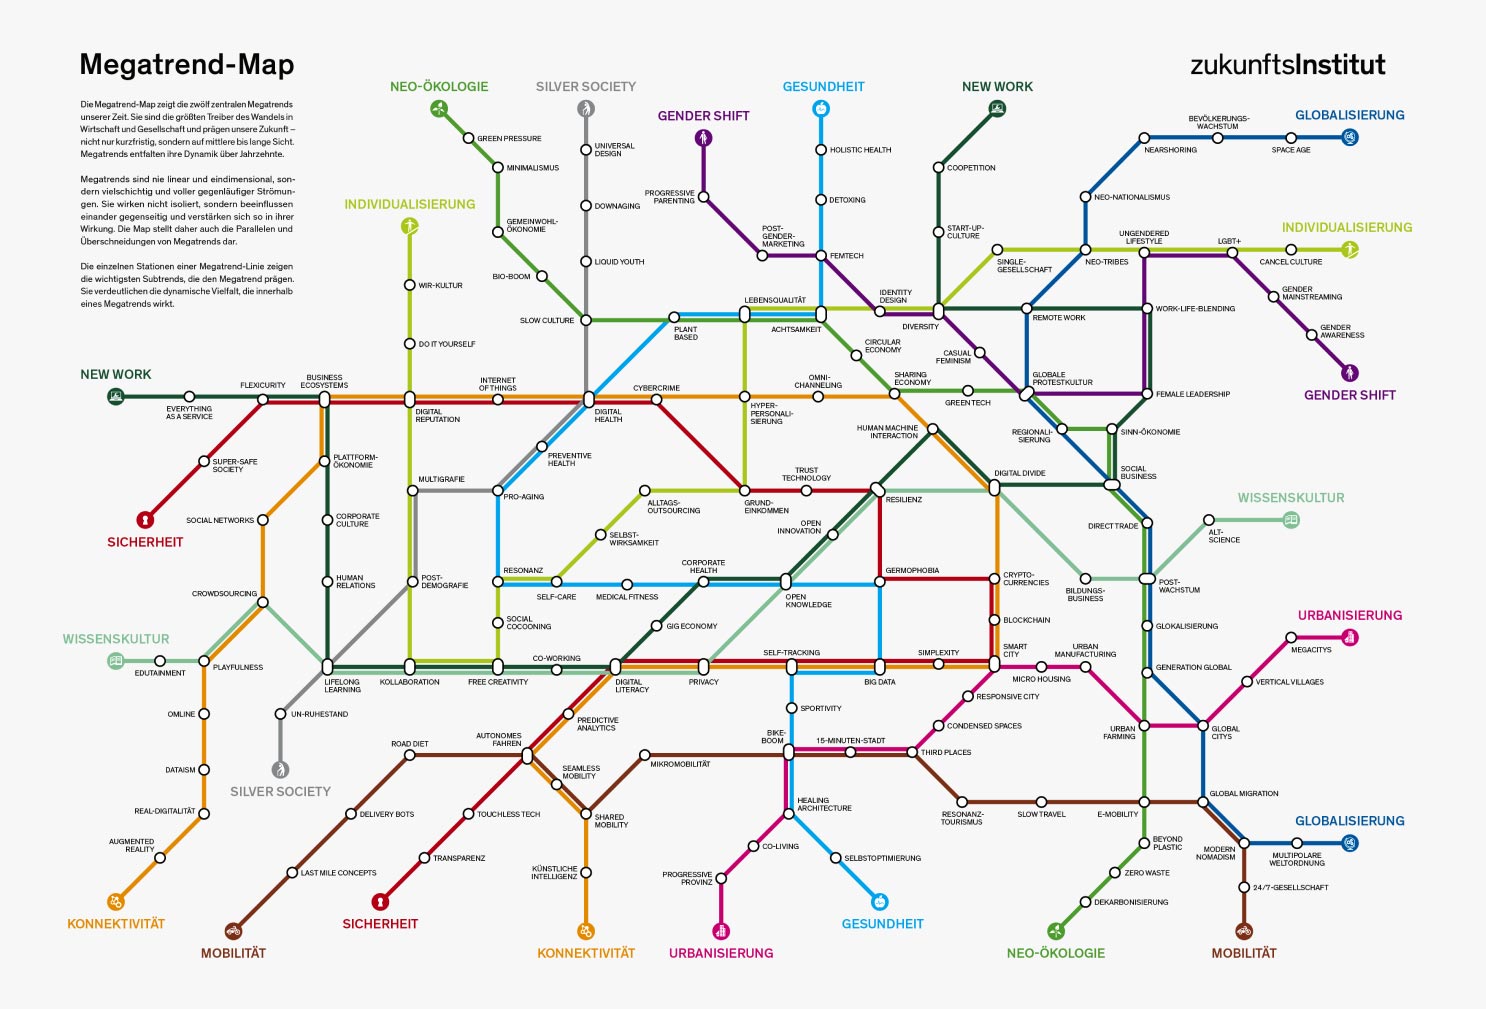
Best practice for lots of information: The Future Institute's Megatrend Infographic
Even a successful infographic cannot stand on its own. However, the Zukunftsinstitut uses it as a simple and exciting introduction to the results of an extensive study on social developments. Here, too, the context is King: the actual information is available on demand and can be accessed according to individual interest(Cf. source 4).
Three things to watch out for:
- The infographic focuses on the results of the study and abstracts them to an image we all know: a traffic network. As a result, we automatically know how to read the graphic.
- Individual lines show the major trends of our time, but also illustrate contextual connections between different developments and invite us to use the infographic to get an overview.
- The map can also be customized: The option to receive a company-specific version? Smart and customer-centric. And an exciting CTA in lead generation: after all, this version is only available on request.
The conclusion
The core of successful visualization is a customer-centric presentation of what we have to say - about ourselves, our products or services. Visualization anchors companies and products directly in the brain of the recipient. Only when it complements the context in a target-oriented way does it support the communication of complex issues and reach the pinnacle of B2B communication.
If you are interested in a deep dive on how good storytelling in design and text can support your brand or you have a completely different topic request: We welcome your question.
Sources
1) Jessica Röhner, Astrid Schütz: Psychologie der Kommunikation. 2nd ed. Springer Verlag, Wiesbaden 2015, ISBN 978-3-658-10024-7, p. 21
Originally developed from a purely technical perspective, the sender-receiver model evolved into a communication model with a psychosocial component.
2) Hans-Georg Häusel: The Scientific Foundation of the Limbic® Approach, last accessed on 09/28/2021
3) Celonis, e-book "Meet the Execution Management System", last accessed on 08/11/2021
4) Zukunftsinstitut: Dossier Megatrends, last accessed on 08/09/2021.